[ed. note: Data @ IFRC is a blog series to share highlights from data-driven Red Cross Red Crescent national societies, learning opportunities and thought pieces on all things data from ethics to evidence.]
Considering Data literacy journeys with IFRC Africa Region
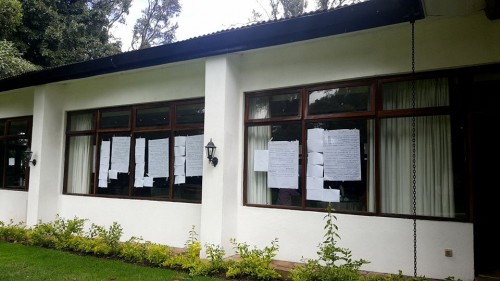
Converting data literacy theory to practice needs a large infusion of reality. The more people I meet the more value is added as we plan for data literacy programs at the individual and institutional levels. Last week I joined my IFRC Africa colleagues from the regional office as well as the leaders for various country offices and cluster heads. There are 49 national societies (Red Cross/Red Crescent societies) represented by the IFRC Africa Regional office. Countries in the MENA region are supported by the IFRC Beirut office. We converged in Mount Kenya to dive into the strategic plan and roadmap for the coming year. By the end of the week, the walls were covered with charts, lists, and plans. Distilling some of the immediate and future needs, it was a great opportunity to sanity check my data literacy work plan for the coming year. We focused on how to engage youth while supporting some complex changes across countries and major thematic work such as disaster resilience and health. They inspire me with their hard, complex work accompanied by their earnest efforts to incorporate data literacy into their activities. The upcoming IFRC Data Playbook will be co-created across the regions, clusters, thematic areas by many people. Thankfully, we are building alliances with the data leaders, emerging data savvy and the data curious.
YouthMappers Nairobi
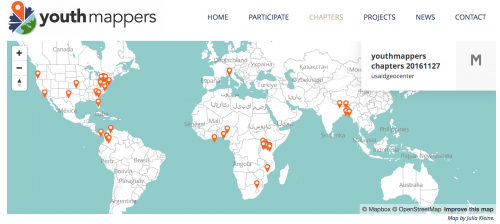
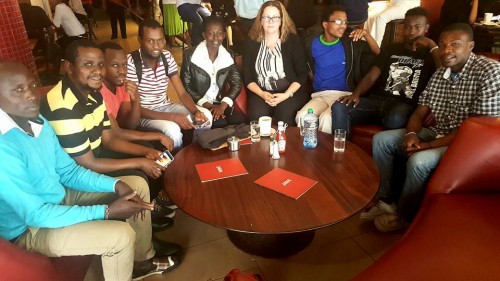
Kenyan Red Cross volunteer Esther Muiruri mentioned that the average age in Kenya is 18. If we are going to be data-driven and engage youth, then it is most fortunate that groups like YouthMappers, Map Kibera and Map Mathare are flourishing. From university students to local community leaders, I had an opportunity to connect with the Nairobi YouthMappers Chapter. There are 3 chapters across Kenya. Already they have supported a number of local and international humanitarians and development programs.
(map source: YouthMappers)
Modeling programs
There are many models for implementing shifts in a workplace. Some organizations host interns and fellowships to bring new areas of knowledge into organizations. To be honest, data use is all around IFRC. While assessing ‘data readiness’, my assumption is that there are a number of existing and emerging data leaders within the Federation. We must host skillshares or even consider internal mentorship programs. It really depends on the connections to curate an ecosystem map or, as humanitarians like to name, 3Ws (who, what, where). Slowly we are collecting data on ourselves.
While there are many frameworks to assess data readiness for countries, there are few for individuals or organization. Like any framework, there is a coldness in them, but it helps to give some focus on the data reality check as well as the socialization and feelings (eg. fear of change) that might be considered. Here is a sample of those competency frameworks:
- Web Literacy via Mozilla (problem solving, collaboration, creativity and communication),
- Digital Literacy via the World Economic Forum (digital identity, digital rights, digital literacy, digital communications, digital emotional intelligence, digital security, digital safety, and digital use), and
- Critical Social Impact Skills (below) Social Impact competencies
Competencies for Social Impact:
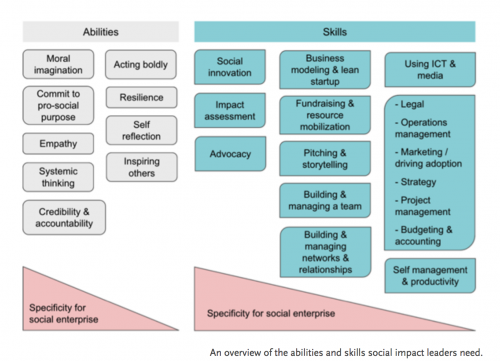
(source: Stanford Social Innovation Review, November 23, 2016)
There are many skills leading up to being a ‘data journalist’ or a ‘data scientist’. Just like any functioning company or organization, we need both soft and hard skills to make this happen. I am most fascinated with building ways we can add small, medium and large tasks/learning opportunities. This means convening and deputizing advocates as I go.
The Netherlands Red Cross and colleagues created this diagram of ‘the Humanitarian Data Scientist’. I think it is really the ‘Humanitarian Data Team’ as many of the skills rest in individuals across the organization.
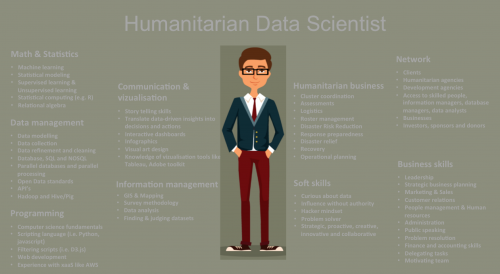
(Credit: Maartin van der Veen, 510, Netherlands Red Cross)
Evidence-Based Decision-making
The reason we are focused on data literacy is to get data ready. We aim to improve evidence-based decision-making. In parallel, many colleagues are working on technology solutions to connect all the various data elements by topic and region. Humanitarians are very mindful that people come before data. As danah boyd rightfully pointed out this week, we do need to be sure the machines meet our values with algorithm accountability.
Short Video (5 minutes): “Transparency ≠ Accountability” (article)
There is a mailing list for computer scientists driving this agenda: “fairness, accountability, and transparency in machine learning” (FATML) (click to join)
(photo credits: Heather Leson, CCby)