[ed. note: Data @ IFRC is a blog series to share highlights from data-driven Red Cross Red Crescent national societies, learning opportunities and thought pieces on all things data from ethics to evidence.]
[ed. note: Data @ IFRC is a blog series to share highlights from data-driven Red Cross Red Crescent national societies, learning opportunities and thought pieces on all things data from ethics to evidence.]
This week I had a chat with a colleague about our theory of change. To me, success is data skills increased in the organization (outside the IT department) by closing the gap between technical and traditional ‘non-technical’ humanitarian roles. Some of the key skills required to be data ready are not data science related but more about how we share and communicate. Over on the General Assembly blog this piece illuminates that Data Skills can be acquired by those with non-math backgrounds. “Non-math backgrounds bring new perspectives to data analysis.”
Learning Opportunities
Have you made some resolutions to learn new things? There are numerous courses kicking off soon: satellite imagery, mobile literacy curriculum, data analysis and data visualization.
ESRI Massive Open Online Course on Satellite Imagery: “Digital images of earth’s surface produced by remote sensing are the basis of modern mapping. They are also used to create valuable information products across a spectrum of industries. This free online course is for everyone who is interested in applications of earth imagery to increase productivity, save money, protect the environment, and even save lives.”
Mobile Information Curriculum:“The Mobile Information Literacy curriculum is a growing collection of training materials designed to build information literacies for the millions of people worldwide coming online every month via a mobile phone.”
For years, many of us have been working in community engagement. Community data as core to any project’s success. New articles from Civicus “Making Citizen Generated Data Work” and ICRC “Can Citizen Driven Response Improve Humanitarian Action.” Both are excellent works. But, we need to start dropping “citizen” and replace it with “Community” to be more inclusion. Many people live in areas where they are not ‘citizens’. Data is often about ‘power’ and ‘inclusiveness.’
BBC has released their documentary “The Joy of Data” on youtube. In one hour, dive into the “witty and mind-expanding exploration of data, the story of the engineers of the data age, people most of us have never heard of despite the fact they brought about a technological and philosophical revolution.”
Just the tools, please
You are swamped and have no time for a course? The World Bank has you covered:
Are you designing workshops or leading teams? Our friends over at Fabriders have compiled an extensive list of Session Design tips, including the often overlooked “How Adults Learn.”
Digital security is increasingly a concern. Over at Electronic Frontier Foundation, they have tailored security learning packages for numerous user groups. The closest group to our humanitarians is journalists. How can we be data ready and ensure data protection? This is a high priority of the Movement. Thankfully, there are leaders like Rakesh Bharania taking aim at this literacy gap:
“Humanitarian action is increasingly dependent upon ICT. In the absence of legislation and standards within the community, humanitarian organizations must recognize the Obligation to Protect as it applies to information security, data protection and privacy as an essential part of the humanitarian mission. All humanitarian actors – whether they work for a humanitarian agency, are crowd-sourced volunteers on the Internet, or from the private sector – must be educated on the Obligation to Protect and how all parties must ensure appropriate and secure use of ICT and datasets.”
The Center for Humanitarian Data (an OCHA initiative) is set to open in August 2017. Check out their website for details. They are building tools and processes using open source and open data principals.
[ed. note: Data @ IFRC is a blog series to share highlights from data-driven Red Cross Red Crescent national societies, learning opportunities and thought pieces on all things data from ethics to evidence.]
December is full of data – not enough sleep, all the deadlines and mountains of details. This dispatch of Data @ IFRC will cover examples of new data uses across the Federation, some insights from global events and, of course, some resources/reading.
Participatory Video
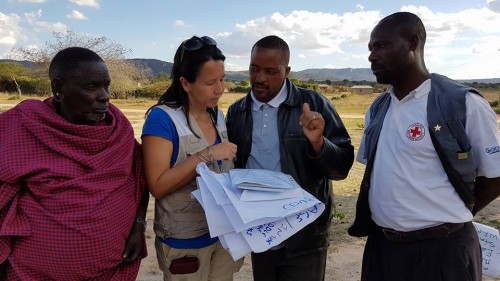
Often when we consider ‘data collection’, we tend to focus on math and stats. Data comes in all sizes and shapes. While there is some debate about how to weigh qualitative and quantitative data, we are a humans first organization. My colleague Miki Tsukamoto is piloting a project on Participatory Video for Evaluation in Ndaleta, Tanzania. This project was done in collaboration with the communities, a Participatory Video team and the Tanzania Red Cross Society.
We also have some great practices in community engagement for local voices. As we consider how to share the data journey @ IFRC, it will mean demonstrating impact with stories and data bits. To us, they go hand and hand.
Maps for Climate Change and the SDGs
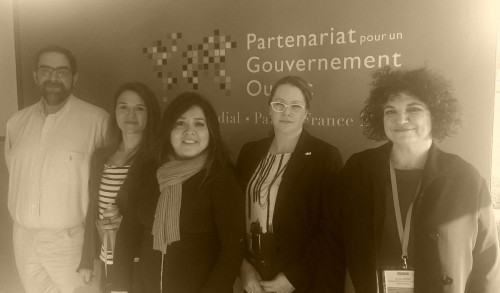
It was my pleasure to chair a panel at the Open Government Partnership all about Open Mapping. The session focused on how maps could make a difference in cities by illustrating examples from community engagement, mapping business, opensolarmap as well as sharing how mapping electricity could help.
The outcome of this session was to demonstrate that by involving the community in mapping, we can city-build together to achieve our SDG goals but that civil society, organizations, governments and business will need to collaborate.
(photo of Christian Quest, Christina Franken, Miriam Gonzalez, Heather Leson and Davida Wood.)
Thanks to the panelists for a dynamic conversation.
Building Data Literacy Networks
At IFRC, there are many data leaders and data curious. We hosted an informal Data Working group session to talk about what people want to learn/share. We also identified some opportunities and barriers. Often when people talk about ‘data literacy’, they leap to IT or data science. We aim to build inclusive which is why I was delighted to have a wide range of participants from HR, the Library, IT, Health, Emergency Response and my colleagues from Policy, Strategy and Knowledge. Together we determined a roadmap for skillshares and plans to help each other on our data-driven innovation journey.
“The purpose of the standards, initiated and led by the International Committee of the Red Cross (ICRC) and involving several humanitarian and human rights NGOs and UN agencies, is not to provide a ‘how-to’ guide for practitioners but, rather, to establish a living body professional standards informed by international law, professional ethics, good practice, and operational reality.”
You don’t have to be a data scientist to innovate with data.
This really rings true as I look around at the activities across the Red Cross Red Crescent movement. Small data and data skills are among us. Plus we have many diverse skills that could complement the existing knowledge in house. We will need to be ready for data science, especially in the Information Management roles, but there are other ways to innovation. Colleagues over at UNDP have been doing great work:
“Data innovation is the use of new or non-traditional data sources and methods to gain a more nuanced understanding of development challenges.”
[ed. note: Data @ IFRC is a blog series to share highlights from data-driven Red Cross Red Crescent national societies, learning opportunities and thought pieces on all things data from ethics to evidence.]
Considering Data literacy journeys with IFRC Africa Region
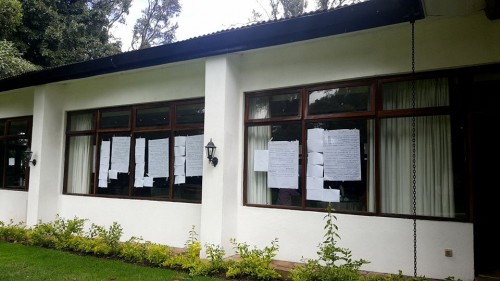
Converting data literacy theory to practice needs a large infusion of reality. The more people I meet the more value is added as we plan for data literacy programs at the individual and institutional levels. Last week I joined my IFRC Africa colleagues from the regional office as well as the leaders for various country offices and cluster heads. There are 49 national societies (Red Cross/Red Crescent societies) represented by the IFRC Africa Regional office. Countries in the MENA region are supported by the IFRC Beirut office. We converged in Mount Kenya to dive into the strategic plan and roadmap for the coming year. By the end of the week, the walls were covered with charts, lists, and plans. Distilling some of the immediate and future needs, it was a great opportunity to sanity check my data literacy work plan for the coming year. We focused on how to engage youth while supporting some complex changes across countries and major thematic work such as disaster resilience and health. They inspire me with their hard, complex work accompanied by their earnest efforts to incorporate data literacy into their activities. The upcoming IFRC Data Playbook will be co-created across the regions, clusters, thematic areas by many people. Thankfully, we are building alliances with the data leaders, emerging data savvy and the data curious.
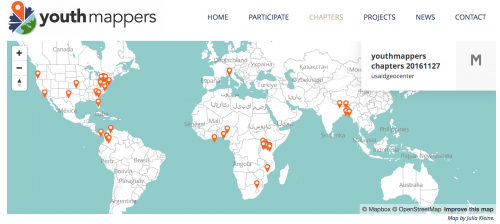
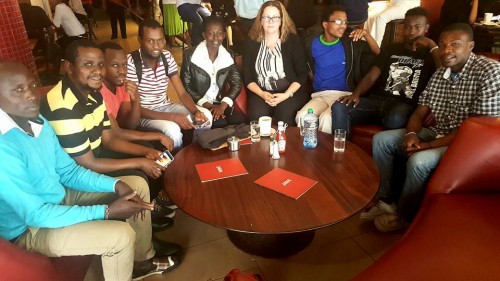
YouthMappers Nairobi
Kenyan Red Cross volunteer Esther Muiruri mentioned that the average age in Kenya is 18. If we are going to be data-driven and engage youth, then it is most fortunate that groups like YouthMappers, Map Kibera and Map Mathare are flourishing. From university students to local community leaders, I had an opportunity to connect with the Nairobi YouthMappers Chapter. There are 3 chapters across Kenya. Already they have supported a number of local and international humanitarians and development programs.
There are many models for implementing shifts in a workplace. Some organizations host interns and fellowships to bring new areas of knowledge into organizations. To be honest, data use is all around IFRC. While assessing ‘data readiness’, my assumption is that there are a number of existing and emerging data leaders within the Federation. We must host skillshares or even consider internal mentorship programs. It really depends on the connections to curate an ecosystem map or, as humanitarians like to name, 3Ws (who, what, where). Slowly we are collecting data on ourselves.
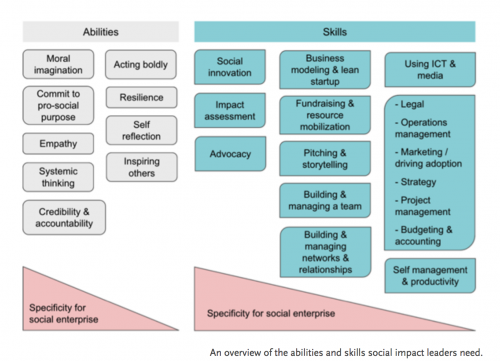
While there are many frameworks to assess data readiness for countries, there are few for individuals or organization. Like any framework, there is a coldness in them, but it helps to give some focus on the data reality check as well as the socialization and feelings (eg. fear of change) that might be considered. Here is a sample of those competency frameworks:
Digital Literacy via the World Economic Forum (digital identity, digital rights, digital literacy, digital communications, digital emotional intelligence, digital security, digital safety, and digital use), and
There are many skills leading up to being a ‘data journalist’ or a ‘data scientist’. Just like any functioning company or organization, we need both soft and hard skills to make this happen. I am most fascinated with building ways we can add small, medium and large tasks/learning opportunities. This means convening and deputizing advocates as I go.
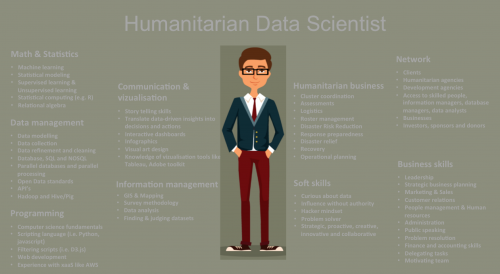
The Netherlands Red Cross and colleagues created this diagram of ‘the Humanitarian Data Scientist’. I think it is really the ‘Humanitarian Data Team’ as many of the skills rest in individuals across the organization.
(Credit: Maartin van der Veen, 510, Netherlands Red Cross)
Evidence-Based Decision-making
The reason we are focused on data literacy is to get data ready. We aim to improve evidence-based decision-making. In parallel, many colleagues are working on technology solutions to connect all the various data elements by topic and region. Humanitarians are very mindful that people come before data. As danah boyd rightfully pointed out this week, we do need to be sure the machines meet our values with algorithm accountability.
There is a mailing list for computer scientists driving this agenda: “fairness, accountability, and transparency in machine learning” (FATML) (click to join)
[ed. note: Data @ IFRC is a blog series to share highlights from data-driven Red Cross Red Crescent national societies, learning opportunities and thought pieces on all things data from ethics to evidence.]
What resources and frameworks can we draw on to build a data-driven organization? Fortunately on this journey, I have had the opportunity to meet many colleagues working on a variety of thematic areas around the globe. Just in the past week I found myself in a room of civil society data and security leaders, health practioners (community event-based health surveillance) in Geneva with the Norwegian Red Cross, Canadian Red Cross and more, a roadtrip with the American Red Cross to visit a software provider and now I’m in Kenya learning from leaders from across the continent of Africa. Truly, late December will be for distilling and napping.
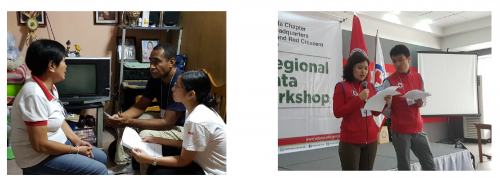
Mobile Data Collection Training Workshop in Asia (Philippines)
There are many mobile data collection projects and tools used across all the IFRC network. My colleague Miki Tsukamoto recently co-hosted a workshop to collect best practices with many National Societies including Australian Red Cross, Bangladesh Red Crescent Society, the Hong Kong Branch of Red Cross Society of China, Mongolian Red Cross Society, Myanmar Red Cross Society, New Zealand Red Cross, Pakistan Red Crescent Society, Philippines Red Cross, Vanuatu Red Cross and the Vietnam Red Cross Society.
The workshop aimed to combine survey methods, processes and how to use the mobile data collection tool of preference selected by the region. Part of the workshop was practical user testing with a field exercise in Katuhatan (Valenzuela) They worked with volunteers to pilot the questionnaire. I think this is a fantastic way to share best practices in a collaborative way.
Resources everywhere
As we aim to build a data-driven organization, how can we collate relevant resources and obtain guidance both inside the Federation and in the wider networks? One of my core priorities is to create an IFRC Data Playbook. To achieve this goal, I am meeting with people across the Movement and engaging external partners/allies. Their input is invaluable as we co-create this resource. Last week at the Aspiration Non-Profit Software Development Conference, I had the opportunity to meet with a number of people working on Data Literacy topics. Two sessions provided some key questions to think about with data-driven project.
The American Red Cross has been documenting their training materials online. If you are looking to learn more, take a look.(click here) We have a plan to aggregate the multiple data resources to help people on their data journey. This will be done in collaboration and with credit to any individual or organization.
How can we communicate better
Since I joined IFRC, one consistent message is how each team is working to change communications flow with communities. This means we need to understand how some people communicate. While not everyone is online or using social media, the numbers of people on Facebook is still growing. Last week they launched Facebook Community Help for emergencies. I think we can expect more companies to tackle this online.
What about Open Source to support humanitarian work?
Open Source technology supports the backbone of the internet and many organizations. There are a growing number of open source projects across the humanitarian field. Colleagues at ICTWorks created some tips to help guide you.
“Open source, at the end of the day, is one tool of many in increasing impact for stakeholders. Its popularity across all industries and governments is tied to its ability to build faster, smarter technologies. However, building open source in a sustainable way requires approaching it from a developer’s perspective, especially in building a healthy community around any project.”
Read the full article here.
Photos can support your data mission: Climate Change
Data is just part of the story. How can we show impact to augment the data story? The National Geographic shared a series of photos on the impact of Climate Change. Take a look (Click here.)
Information requests
Do you have a data story from the Federation? Please share!
[ed. note: Data @ IFRC is a blog series to share highlights from data-driven Red Cross Red Crescent national societies, learning opportunities and thought pieces on all things data from ethics to evidence.]
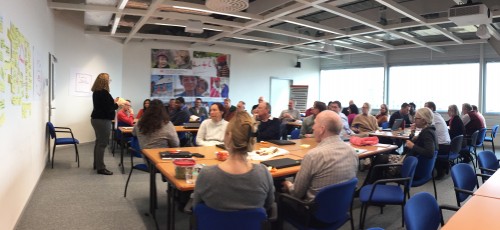
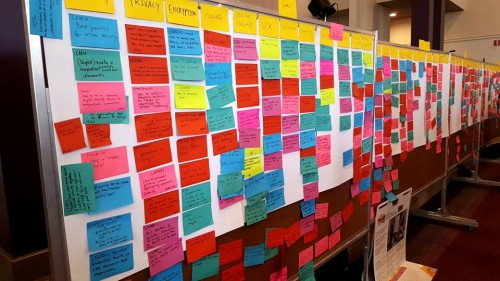
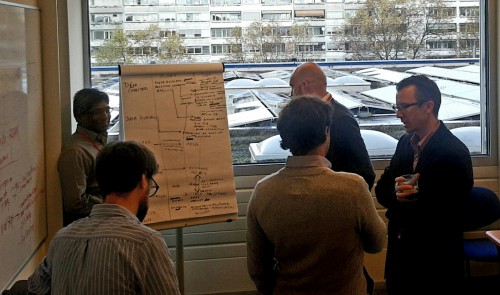
Data strategies for events
Brainstorming is a common concept but have you “Agenda Hacked“? This is a methodology of collecting and collaborating on topics that you want to discuss. This week I am at the Aspiration Non-Profit Software Development. The photo above shows how agendas can be community-driven. Once participants provide their input on what they would like to learn, share, and discuss, the team determines sessions to build out agenda based on the audience. Consider it real-time data collection for decision-making. How can we apply this facilitation method to connect with communities and each other?
Around the Movement
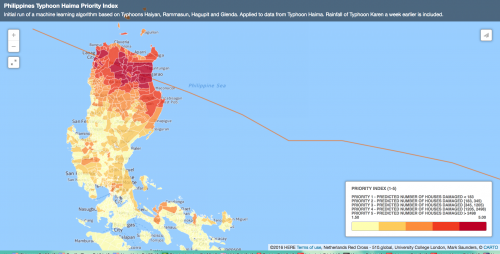
The Netherlands Red Cross initiative team (the 510) has published an article detailing their work using machine learning and predictive modeling.
About the project:“The Priority Index predicts the number of houses damaged per area in the region that is hit by Typhoon Haima. The model is a first attempt at building evidence on how to use data to predict priority areas for humanitarian aid within hours after a typhoon.”
The Red Cross Red Crescent Climate Change Center has a new virtual reality game: “puts users in the shoes of decision makers, letting them decide whether or not to ring an alarm bell, stamp papers for aid delivery, and load supplies into a relief truck – all from a virtual hill overlooking the green valley and the surging waters of the dam.”
Data quality is always a factor when considering programs around the world. Our allies at Alnap are hosting a webinar to help you consider barriers and opportunities: “Flying blind: gathering and using quality information in situations of constrained access.” Register for the webinar
How can Apache’s lessons help Humanitarians?
“The software is not defined by a temporary alliance of business leaders. “Business interest and strategies change and it is not good to be dependent on this.””
One of my big mandates at IFRC is to help guide various open data and open source initiatives. In the humanitarian space, this is a delicate navigation due to privacy and security concerns. The lessons of building community and sustainable collaboration are well-worn by leaders at large open source groups like Apache Foundation. Something to ponder as we navigate changes.
What about big data for Food?
This TED talk really nailed the crux of how research and humanitarians can collaborate. As well, Mallory Soldner (speaker) gave a reality check on when data scientists can actually be effective.
(Photo credit: Heather Leson, Aspiration Non-Profit Software Development Summit, November 2016)
[ed. note: Data @ IFRC is a blog series to share highlights from data-driven Red Cross Red Crescent national societies, learning opportunities and thought pieces on all things data from ethics to evidence.]
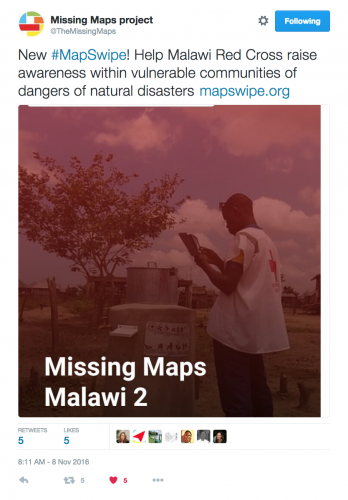
Help the Malawi Red Cross
A few clicks and taps could help the Malawi Red Cross with their humanitarian efforts. Games for change in the humanitarian space are growing. The Malawi Red Cross and Netherlands Red Cross have a programme needs your help. MapSwipe is a gamefied mobile app developed for the Missing Maps Project to enable fast satellite image classification on mobile devices. It is a game that allows anyone to quickly make decisions about which items have roads and/or buildings in the images. These ‘tagged’ images are then sorted to have mappers at Missing Mapathons add the details into OpenStreetMap. Then, the data is used for local programmes like delivering health needs and logistics. The new mission on #MapSwipe for the Malawi Red Cross / Netherlands Red Cross collaboration to raise awareness within vulnerable communities in disaster prone areas of the possible dangers of natural disasters. GET MAPSWIPE: The easy to use MapSwipe app can be used on android and iphone devices. ABOUT Missing Maps – Learn more about MapSwipe and Missing Maps on Facebook.
Go with Data
This week we are sprinting on the GO Project – this is a humanitarian emergency data project to support responders in the Federation. IFRC aims to be a data-driven organization based on evidence based decisions. We provide current IFRC datasets, Red Cross Red Crescent datasets, links to other humanitarian resources and data learning materials. The team is envisioning the next steps to get from prototype to implementation. All the code is online.
“I am arguing that the current focus on data literacy is an opportunity, reflecting back on the nature and role of literacy in history, to promote and foster a consequentialist, broader and thicker, conceptualization of data literacy as literacy in the age of data, one that will allow citizens and societies to challenge current power structures and dynamics to meet their goals, and perhaps the Sustainable Development Goals.”
Alright, so we build!
Building community around data training
One of the items that I am keen to build is a Data playbook to serve the diverse communities within the IFRC and National Societies. The existing leaders are creating materials and we are connecting on how to share widely.
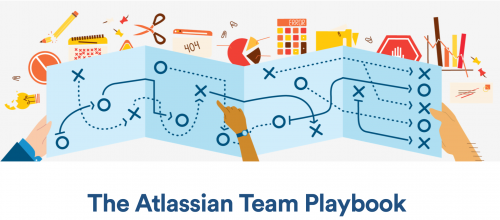
A playbook is a document and/or website that is an editable place with recipes, best practices, and technology. There are many styles and methods to build this type of project. Atlassian just launched a new Playbook which truly rocks with easy to use methods to build digital teams. It is inspiring to consider how we can create data literacy guides like this. (source:”Did Atlassian just crack the code on digital teamwork“.)
[ed. note: Data @ IFRC is a blog series to share highlights from data-driven Red Cross Red Crescent national societies, learning opportunities and thought pieces on all things data from ethics to evidence.]
We have some training highlights from Ecuador, Tool tips from England and an Innovation podcast to feed your brain.
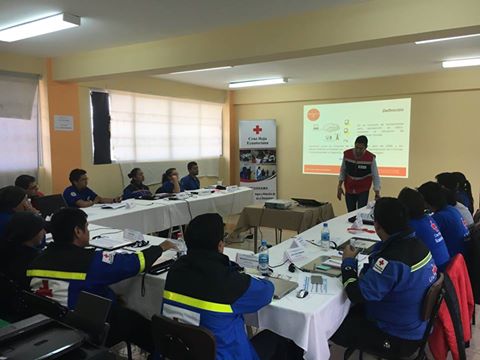
OpenDataKit Training with the Ecuador Red Cross
In Ecuador this week, Boris Gaona lead Ecuadorian Red Cross volunteers in the OpenDataKit (ODK) Advanced Course, given by the IFRC and CREPD Team. Data skills are critical for preparedness and for local capacity building. (photo credit: Boris Gaona)
What is OpenDataKit?
OpenDataKit (ODK) is used around the world by Red Cross Red Crescent staff and volunteers. It is a free and open-source set of tools which help organizations author, field, and manage mobile data collection solutions. With ODK you can create a dataset form or survey, collect the data via mobile, send it to the server than aggregate it to use for reporting or programming.
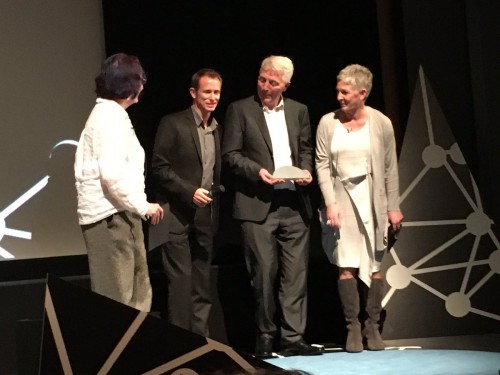
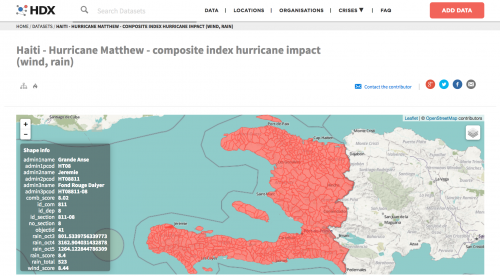
Humanitarian Data Exchange wins award
Humanitarian Data Exchange (HDX) is an open source data site to help humanitarians share data. The project is 5 years young and is being built by an open source community. An example of the collaborative power of HDX is that there were over 1000 downloads of Haiti administrative borders after Hurricane Matthew. A number of Red Cross Red Crescent teams contributing and using HDX. As we grow our efforts on a collaborative and transparent data journey, HDX will be a key partner and means to connect with our humanitarian allies.
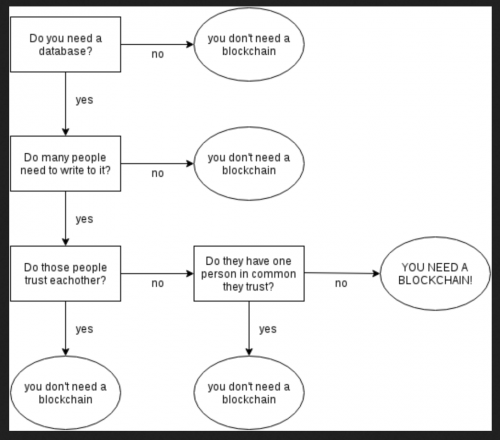
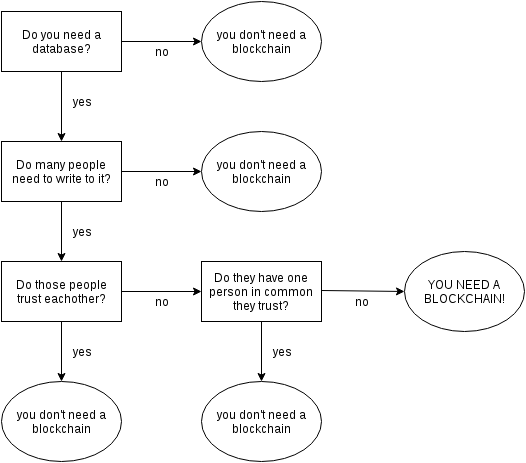
It is hard to know when to add a new technology/process to your budget or workflow. A data ally shared this blockchain articledata and handy chart to help you decide:
***
Speaking of data and standards, Open Referral is busy creating the Human Services Data Specification – an exchange format for publishing machine readable data about health, human, and social services, their locations, and the organizations that provide them.” I wonder how this might help our work?
Learning zone
Simon Johnson is a data leader within the British Red Cross. He created a web cheatsheet to help you on your data basics. Check out his “50 Humanitarian IM Tips.”
The amazing Data Science Central has curated a list of Business Analysis tools. Perhaps one of these might help your work? Click for Business Analysis tools. Note: It is a top 18, not Top 20. Listicles ensue.
Thinking about Mosul
The sheer volume of people displaced in Iraq is overwhelming. Our partners over in IFRC Communications advised that:
“Thousands more people are expected to arrive in the coming days and weeks as fighting around Mosul intensifies. Humanitarian agencies estimate that the fighting could displace more than one million people. This is on top of the 3.2 million already displaced by the conflict. Throughout the country, some 10 million Iraqis are in need of aid.”
Let that sink in as winter approaches – 3.2 million displaced, 1 million about to join them and over 10 million Iraqis are in need of aid.
Consent, Systematic change and Innovation
As we well know, the programmes and planning around data and change require regular big thinks, divergent paths and numerous cups of coffee.
“Is informed consent even possible when data is digital and/or opened? Do we have any way of controlling what happens with that data once it is digital? “
Panthea Lee of Reboot encourages us to think about “upstream data” (reporting) and “downstream data” (programming) as we plan our data-driven projects. “Data is inherently messy. It’s a snapshot of information from a specific time and place. There is a lot of narrative and context and meaning that is embedded in data, that need to be drawn out through conversations. We have to understand decisionmaking, and then adapt and present the data to directly support it.”
[ed. note: Data @ IFRC is a blog series to share highlights from data-driven Red Cross Red Crescent national societies, learning opportunities and thought pieces on all things data from ethics to evidence.]
How can we support these existing efforts of data leaders? From youth in Bangladesh to partnerships between humanitarians, researchers and governments, here are some examples of Federation bright spots on our journey to be more data-driven.
Bangladesh Red Crescent and YouthMappers
Students at Dhaka College set up a chapter of YouthMappers. They’ve partnered with the Bangladesh Red Crescent for training and support. The YouthMappers mandate is to not just build maps, but foster a mapping community of leaders.
Sawan Shariar: “I am a volunteer of Bangladesh Red Crescent Society. And now I am working as Youth Chief of Red Crescent Youth, Dhaka College Unit (RCY,DCU). After successfully completed the Training for Training: OpenStreetMap I realize that, this training will be very useful for the volunteers of RCY, DCU. So I tried to understand my teachers and principal, how it’s effective and importance.”
The Netherlands Red Cross data team prepared map and data products to assist in the Typhoon Haima response in the Philippines. They shared all the items on the Humanitarian Data Exchange. The team partnered with researchers combining government data and machine learning to assist with damage assessment prediction.
The Tableau conference on November 7 – 11 is being livestreamed. There are some free hands on courses and demos. Sign up here.
Reading
Given that philanthropy supports the heart of what we do, learning more about the over $300 Billion economy (just in the USA alone) seems like a major priority. A recent publication Philanthropy in Democratic Societies is shining a light and ask for critical thinking around the function and role of these big organizations. Happy reading!
Why does Data Literacy Matter
“In the next economy, the most important skills may be difficult to quantify or commodify—but optimizing for human welfare demands that the people driving the innovation economy take them seriously.”
[ed. note: Data @ IFRC is a blog series to share highlights from data-driven Red Cross Red Crescent national societies, learning opportunities and thought pieces on all things data from ethics to evidence.]
Co-creating spaces and networks to get people involved with technology has always been my passion. At the International Federation of Red Cross Red Crescent, I am contributing to a movement-wide initiative to build a data-driven organization making evidence-based decisions. The role is leading Data Literacy Programs. For years, I’ve been building data learning and use into communities, software projects, NGOS and research institutes. Now, I have an opportunity to support a vibrant network. Join me on this journey as I write as we go. This is a prototype newsletter to serve the community. Feedback welcome.
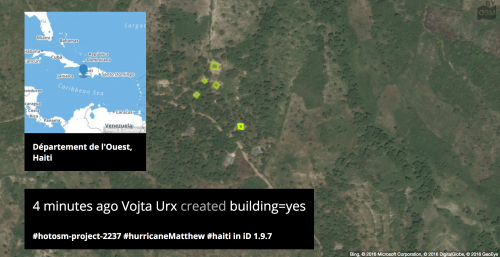
Mapping with the American Red Cross
Around the world, mappers continue to add details to support efforts in Haiti in the wake of Hurricane Matthew. You can see real time edits by clicking this. Also see the overall edit statistics here is a link of global changesets. Some of the projects are being lead by the team at American Red Cross (you can see the progress on the HOTOSM Task Manager (Task Manager – a way for people to divide up the work.)
Number of OSM Contributors: 2,145
Number of Map Changes: 2,734,621
Total number of Changesets: 31,722
2. What is Data Science?
Everyone keeps changing the definition. Over at Data Science Central, they’ve aggregated a list of articles to help you wrap your head around it.
How do we become data literate organizations? Well, over in the social media marketing world, Ryan Holmes is sharing tactics to help organizations become more digital literate. How can we build small interventions and big impacts within our organizations. “The problem — this digital skills gap — was deeper and more pervasive than I realized.” – Ryan Holmes, Hootsuite.
What about small data?
With all this talk about big data, I have been waiting for more praise for small data. There is data nutrition (re:insights) in all types of data. Hamad Haddadi, former colleague, shared a book from some of the Small Data Lab folks: Small Data: tiny clues that uncover huge trends. (Added it to my reading list.)
Measurement
“How to measure” and “what to measure” seems to be constant debate. The Social Progress Imperative launched their SDG( Sustainable Development Goals) measurement report card. Can we or should we use this methodology or a hybrid for NGO programs? And, should we even be measuring unlike things? A recent ICTWorks article shares some thoughts on the value of ranking systems:
“I have a proposal – it’s modest and unsolicited: stop funding rankings. Start, instead, funding internal capacity building workshops – invite experts, practitioners, and providers (whose time you pay for) to start from the issues and your context, and build practical, ethical, user-centered approaches from the ground up.” – Sean Martin MacDonald
I’ve been listening to this audio book for a few weeks. When we think about barriers for using data in humanitarian response, it is always good to know what the machines are up to and some of the ethical questions to consider.
Help wanted
What kind of content would you like to see in my Data reports? Do you have links to share? Send it all my way – heatherleson at gmail dot com.
